This was a semester-long web project developed as part of the CS373 Software Engineering course at UT Austin. The course aims to teach software development practices, maintaining a workflow, handling issues, and continuous integration (CI) similar to what developers deal with in the software industry. The final web product had to be designed to have some form of utility for the internet community.
The website is no longer live after January 2022. It was originally live here
The project’s development was separated into 5 phases:
- Planning and selection of data sources
- Creating a static website with a few data records
- Implementing a database and creating a dynamic website
- Implementing sorting, filtering, searching
- Creating data visualizations and final presentation
Phase 1: Planning and selection of data sources
For the planning phase, we were supposed to select three data models that are interconnected in some way and have sufficient data to be considered separate data models. Our team chose travel-planning in the COVID era as our concept. Our goal was to create a website that showcased the COVID data of various countries, travel advisories to the countries, the latest news from the countries, and airplane routes between the countries. We chose our data models to be countries, airplane routes, and news based on our goals. We also selected a lot of different data sources to support our data models:
- Countries data through Rest Countries API
- Travel advisories through US Department of State API
- COVID data through Covid19 API
- COVID behavior data through UMD Covidmap API
- Airplane routes through Aviation Edge API
- News articles through NewsAPI
- News articles source logos through SerpApi
- News videos through YouTube API
- Embedded maps through Google Maps API
Phase 2: Creating a static website with a few data records
The first step this phase was to reserve a domain name using Namecheap (one domain free per student per year). The DNS routing was handled in a later step once AWS was set up.
For the backend, we were required to use Postman to mock up the API routes we would be serving with our backend in the next phase. I created mock API routes and example JSON responses.
For the frontend, we were required to use ReactJS (with or without TypeScript). We chose to use ReactJS with React Bootstrap for our website’s styling. We added the splash page, the about page, the data model pages and three instances for each data model that are interlinked with each other. Additionally, I spent a lot of time styling the about page and the instance pages.
However, for this phase, a majority of the work was to set up a free account on either the Amazon Web Services (AWS) platform or the Google Cloud Platform (GCP) that would host both the frontend and the backend of our website. We chose the AWS platform because of a bit of past familiarity and also finding a tutorial that was easy to follow.
Using the tutorial, I set up a majority of our AWS architecture. This included using Certificate Manager to set up the DNS routing for the Namecheap domain, and using S3 and CloudFront for deploying our frontend webpages. I also further set up a container using Elastic Beanstalk (EB) and Elastic Container Registry (ECR) to host our future backend.
This is the splash page when visiting the website
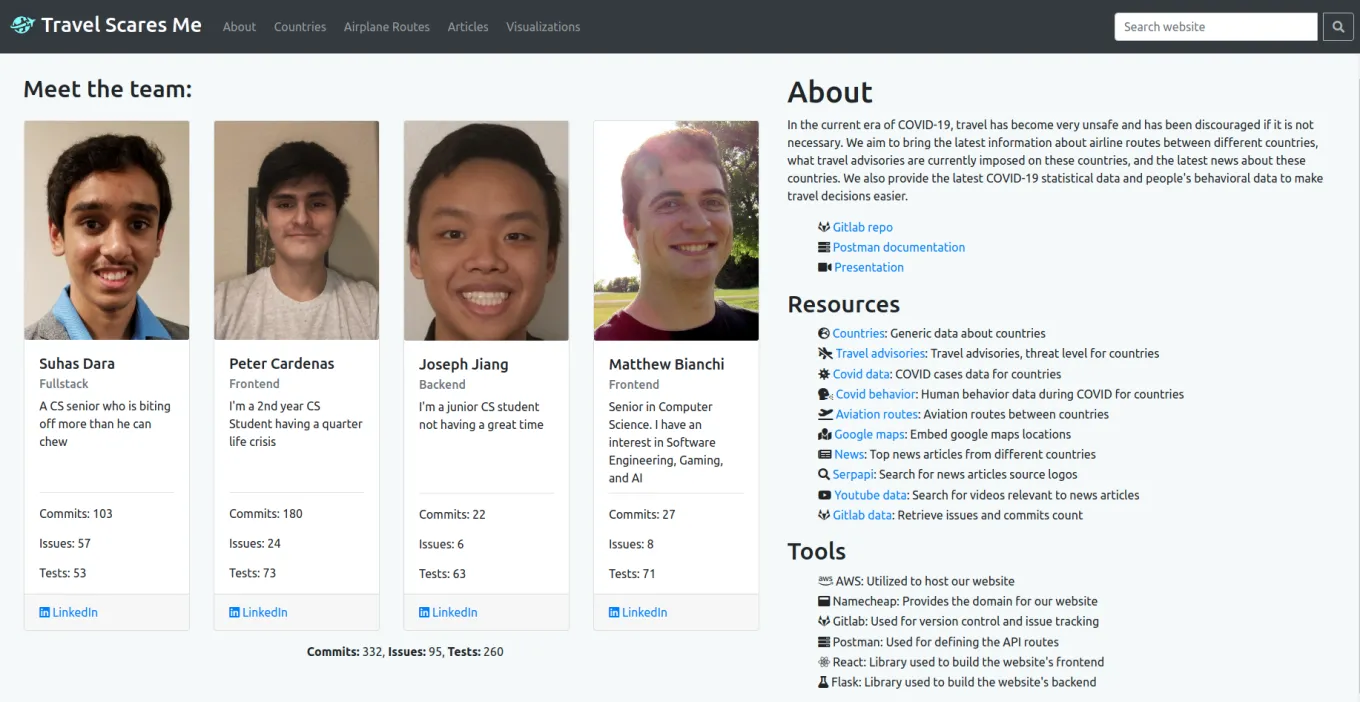
This is the about page that uses the GitLab API for development statistics
Phase 3: Implementing a database and creating a dynamic website
This phase had the largest workload because of the requirement of a functional database with lots of data and a working backend. I scraped data from the chosen data sources, then reformatted the data into a format that allowed loading the data into a MySQL database. We set up a MySQL database using AWS Relational Database Service (RDS) that would serve all our backend database requests.
The frontend was served using a backend server made with Python Flask. The database data was modeled using SQLAlchemy and Marshmallow before being served to the frontend through different API routes as mocked in Postman earlier. Because of our large amount of data, I made the decision to paginate the data within the backend itself, instead of serving the frontend with thousands of data records per data model. A docker image of the backend was created and loaded to AWS ECR for AWS EB to read and host from.
For the frontend, we had to convert our static instance pages to pages that would query the backend for the appropriate data and then display it. Another important aspect was to add pagination to the frontend because of the large number of data records. We allowed changing both the page number and page size of data records.
I spent some time adding YouTube videos and embedded Google Maps to the instance pages using API keys from GCP. These were the only pieces of data that were queried directly instead of being stored in the database. Additionally, I spent quite a decent amount of time styling the frontend, especially the model pages and navigation.
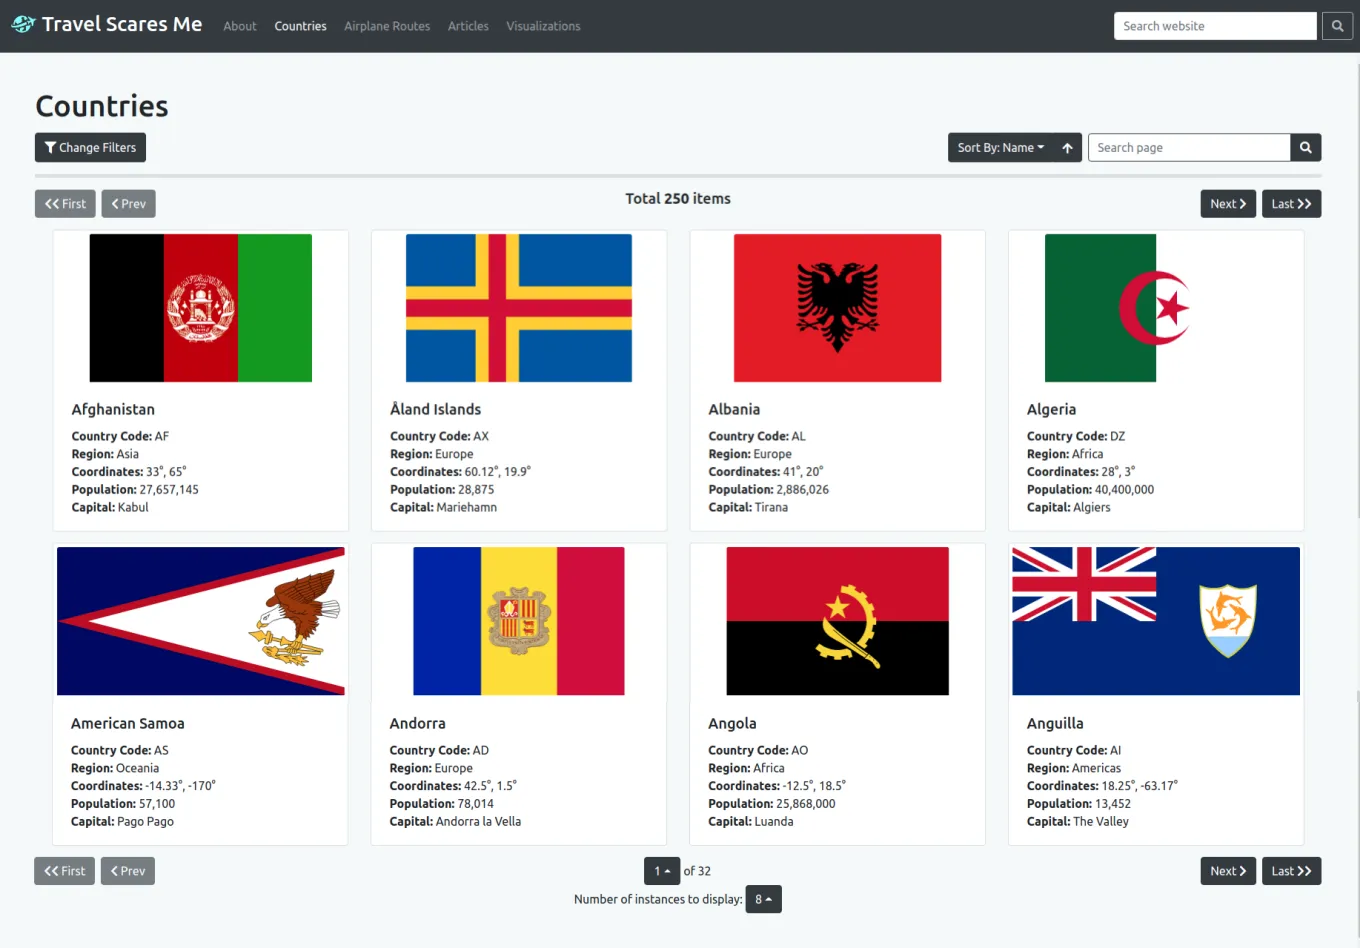
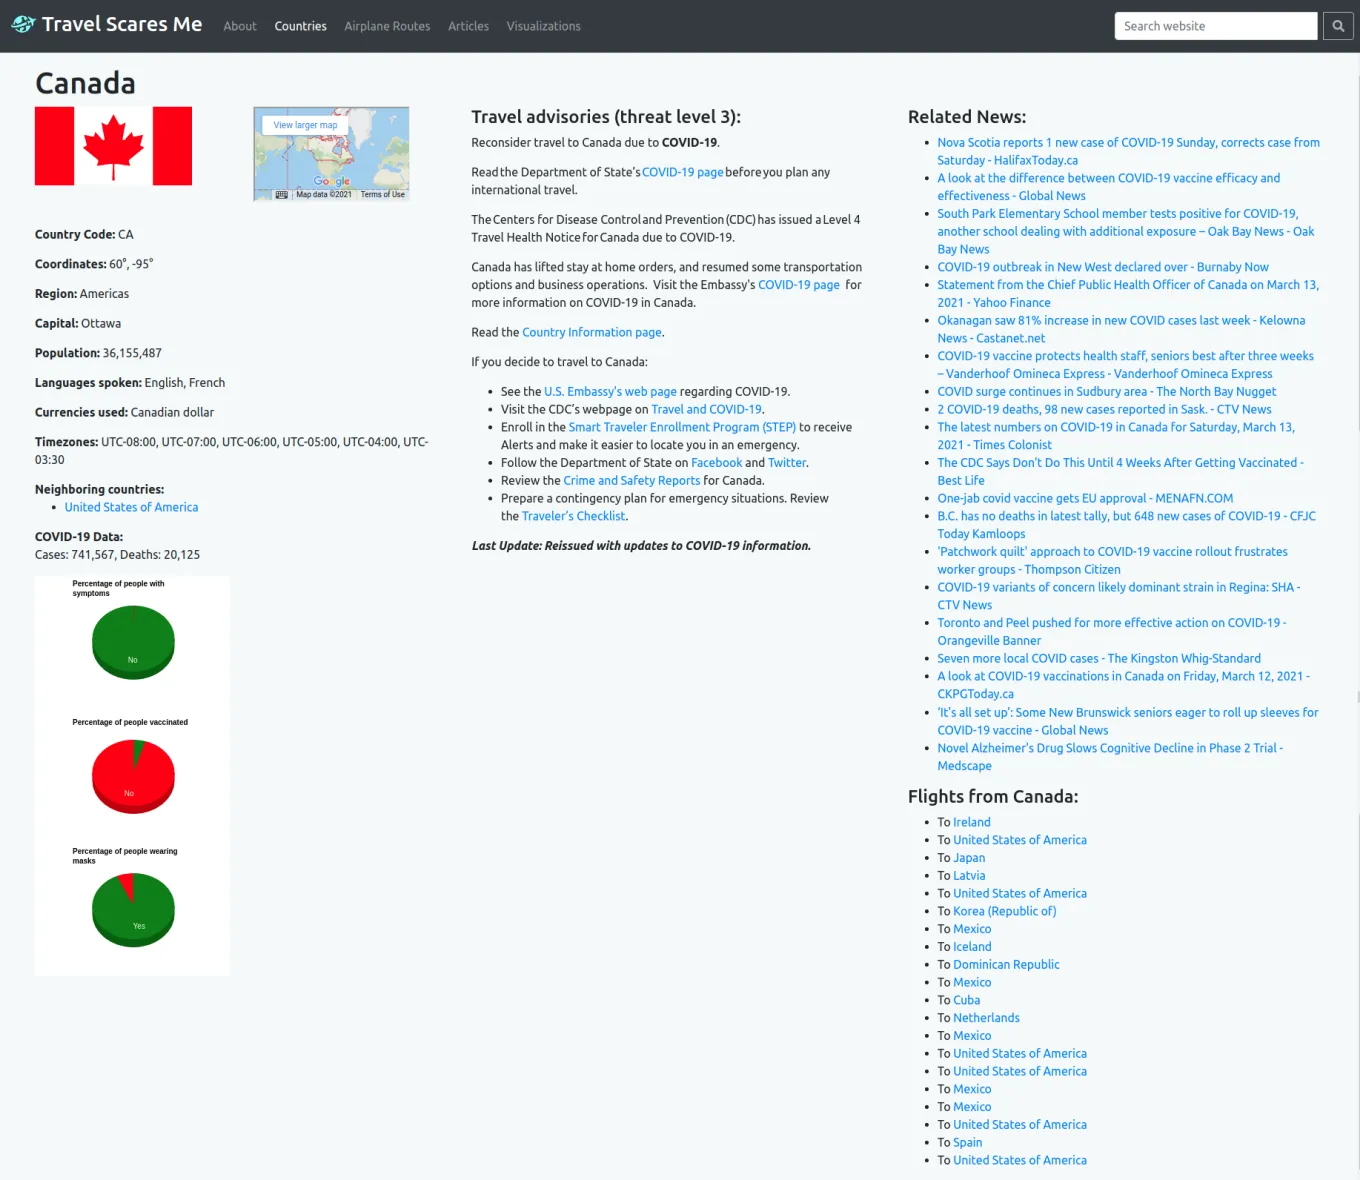
These are the countries model page and instance pages
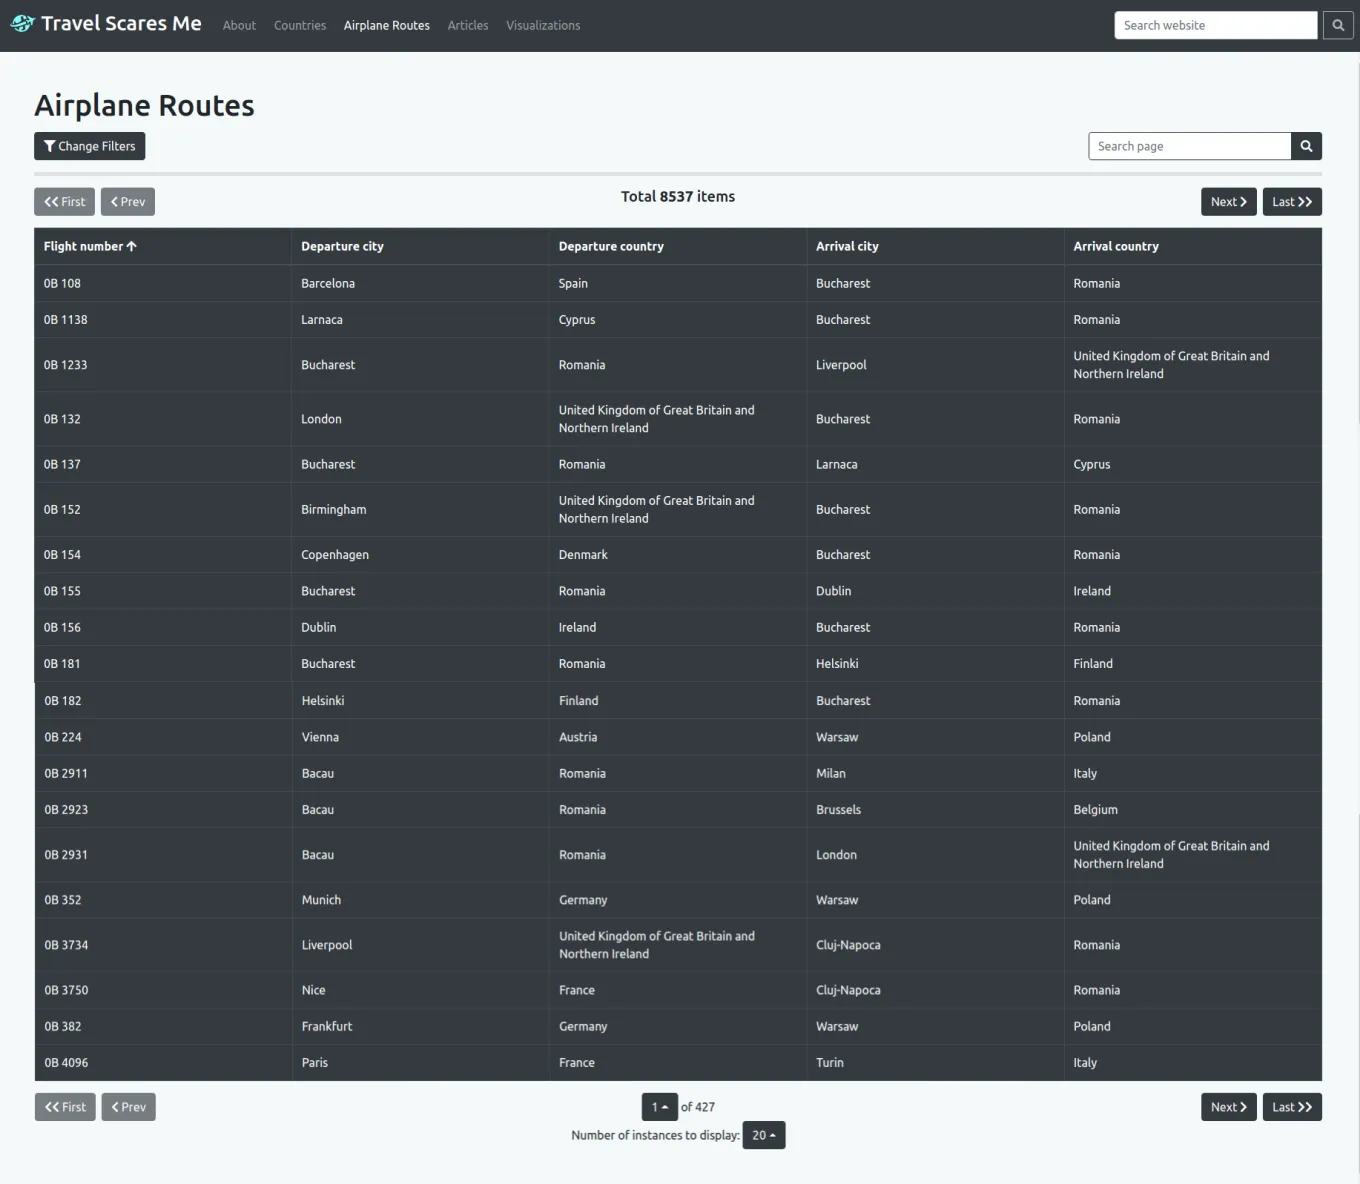
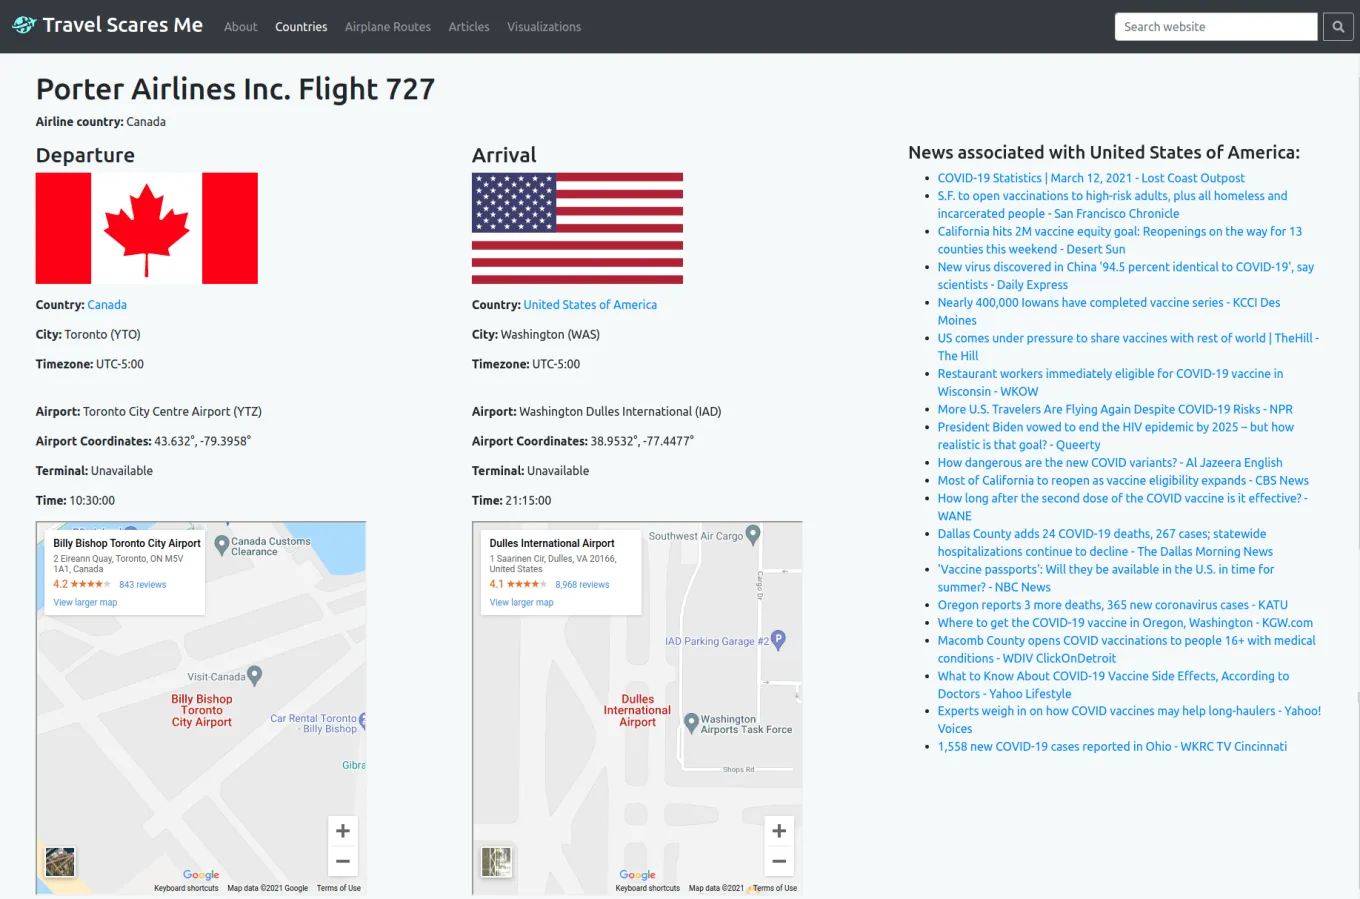
These are the airplane routes model page and instance pages
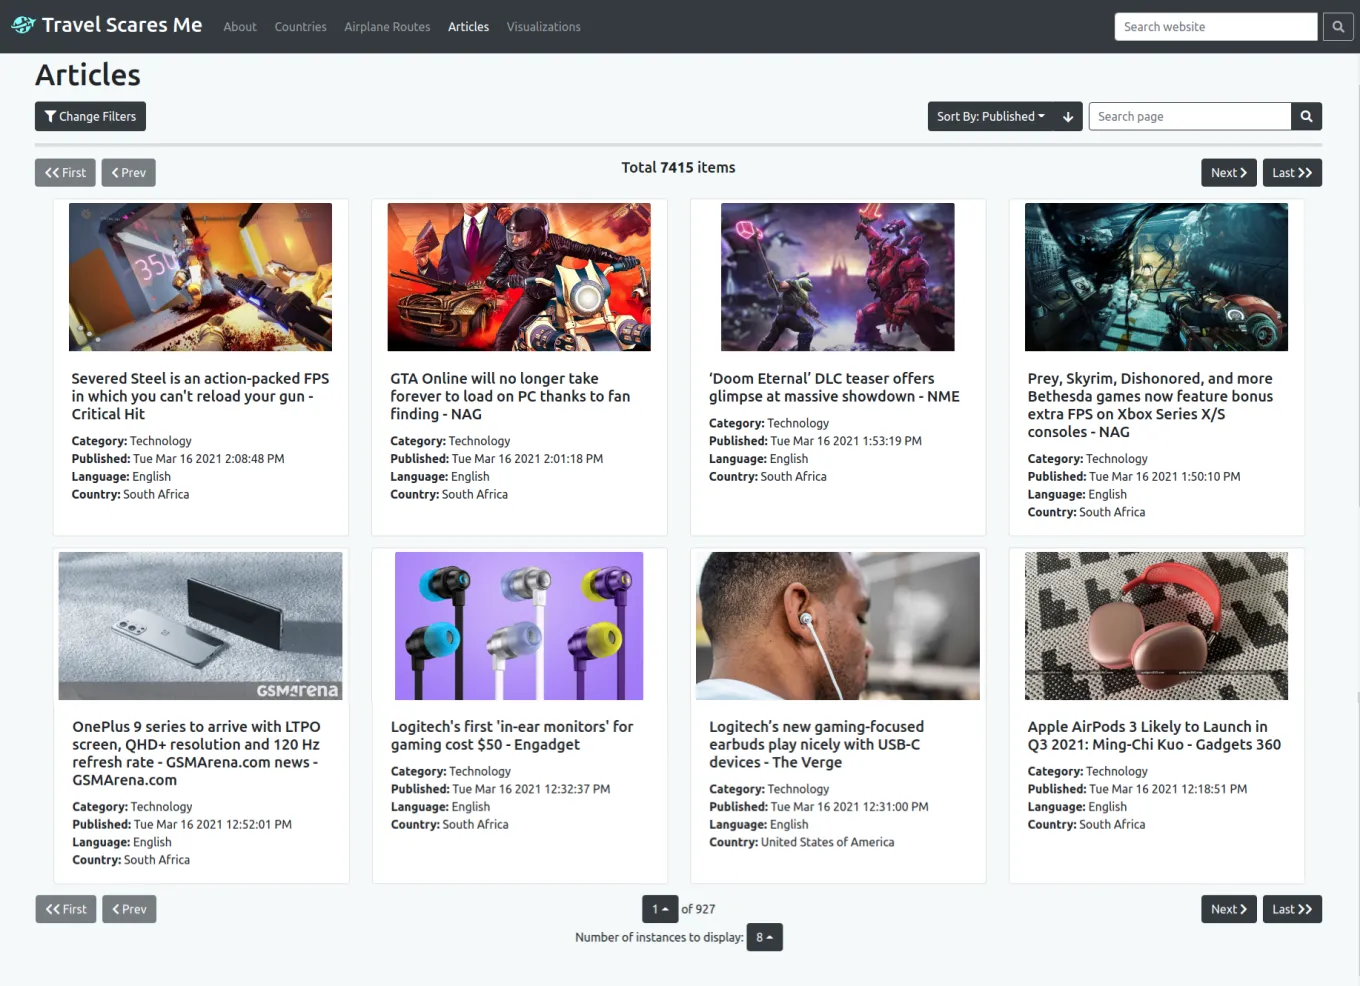
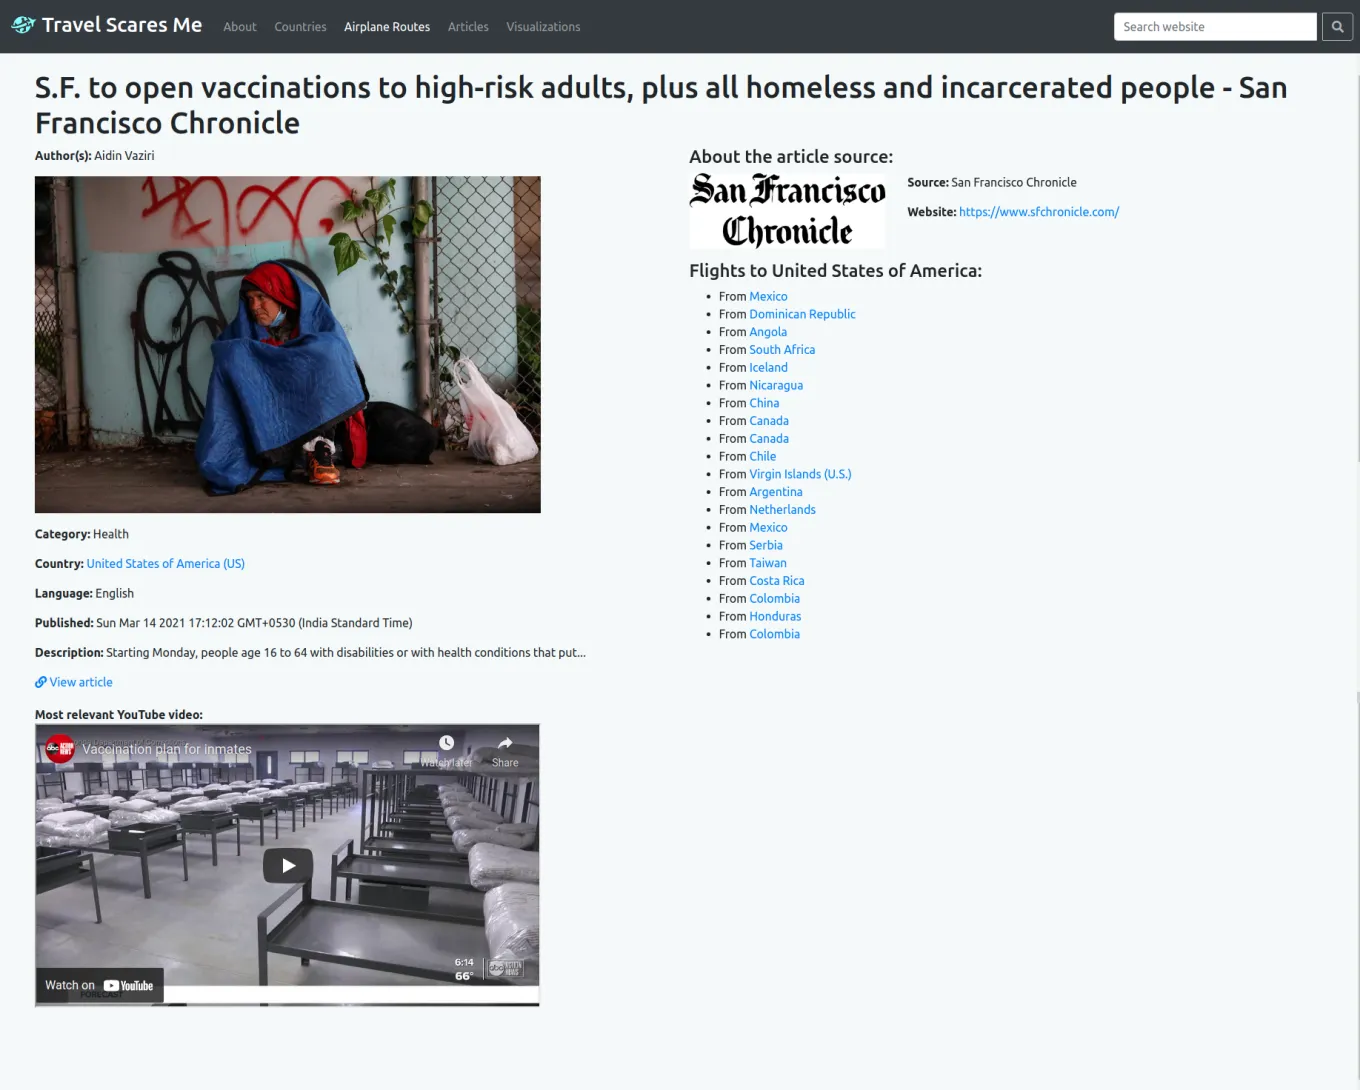
These are the news articles model page and instance pages
Phase 4: Implementing sorting, filtering, searching
The purpose of this phase was to provide the website some actual functionality. Without any form of filtering, sorting, or searching implemented, a user may not accomplish much from the website.
For the data, we had two choices of implementation to move forward with. The first was to serve all the data to the frontend and then use Algolia to perform any filtering, sorting, or searching. I chose the second option which improved on our existing backend architecture by performing the filtering, sorting, and searching using SQLAlchemy. I implemented a variety of API query parameters for each data model, which I also documented in Postman with examples.
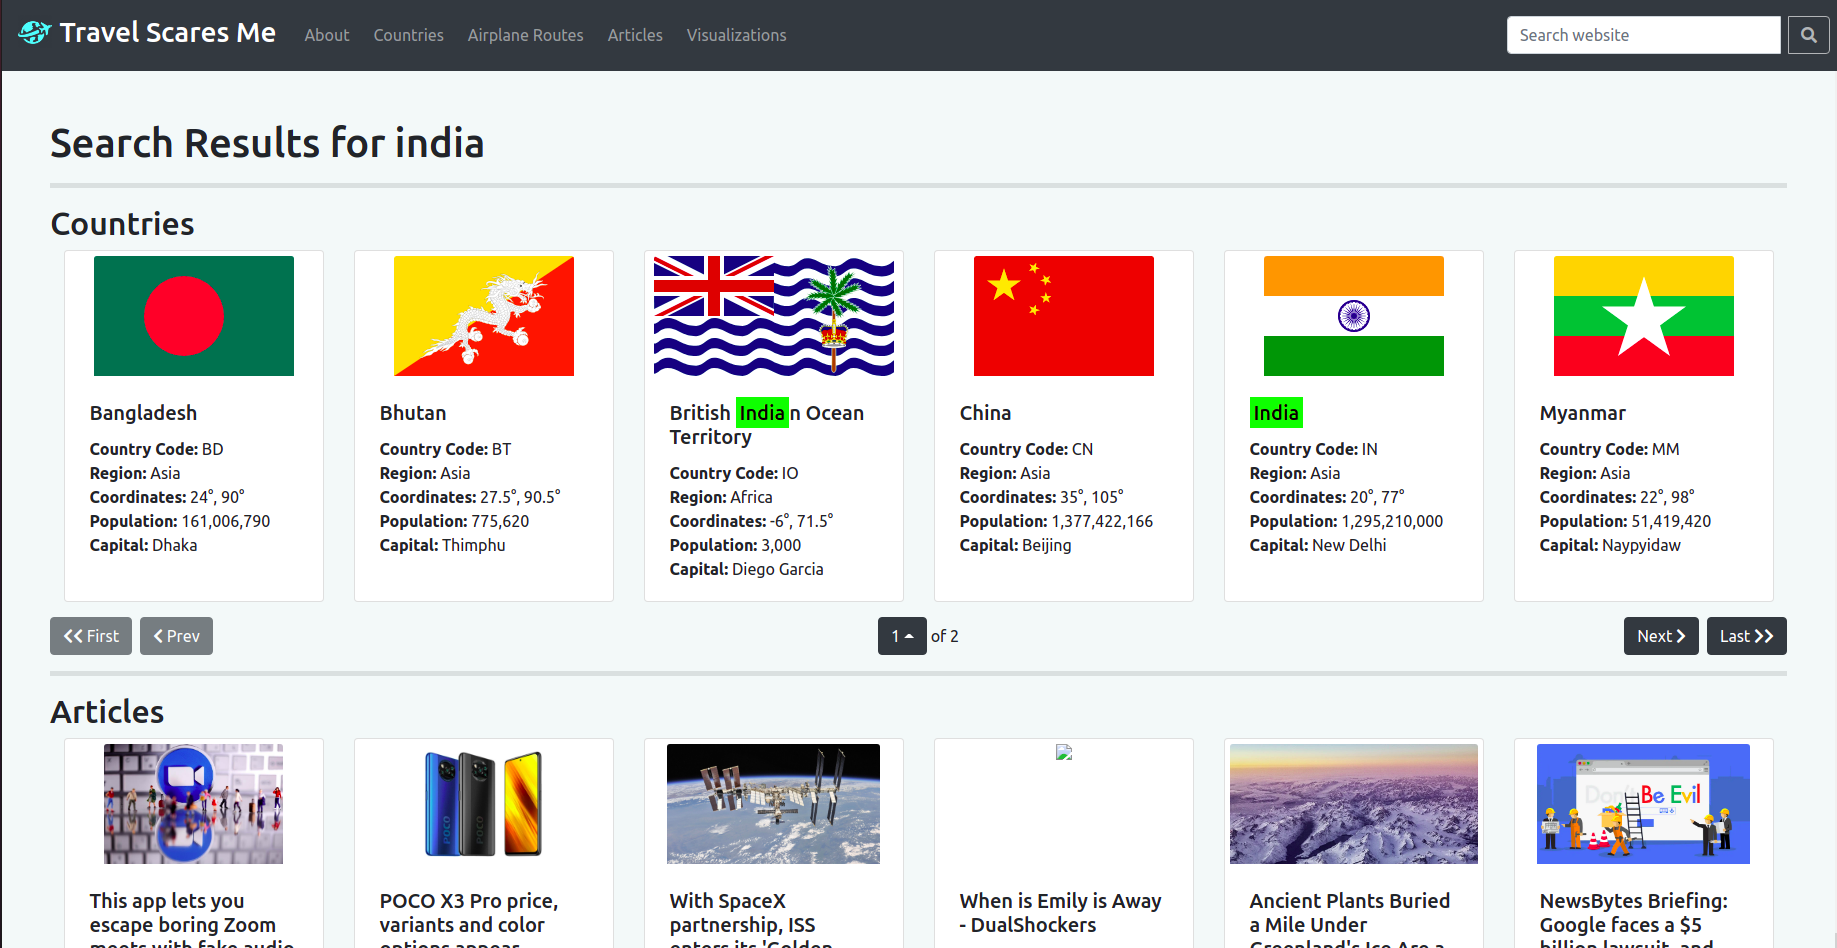
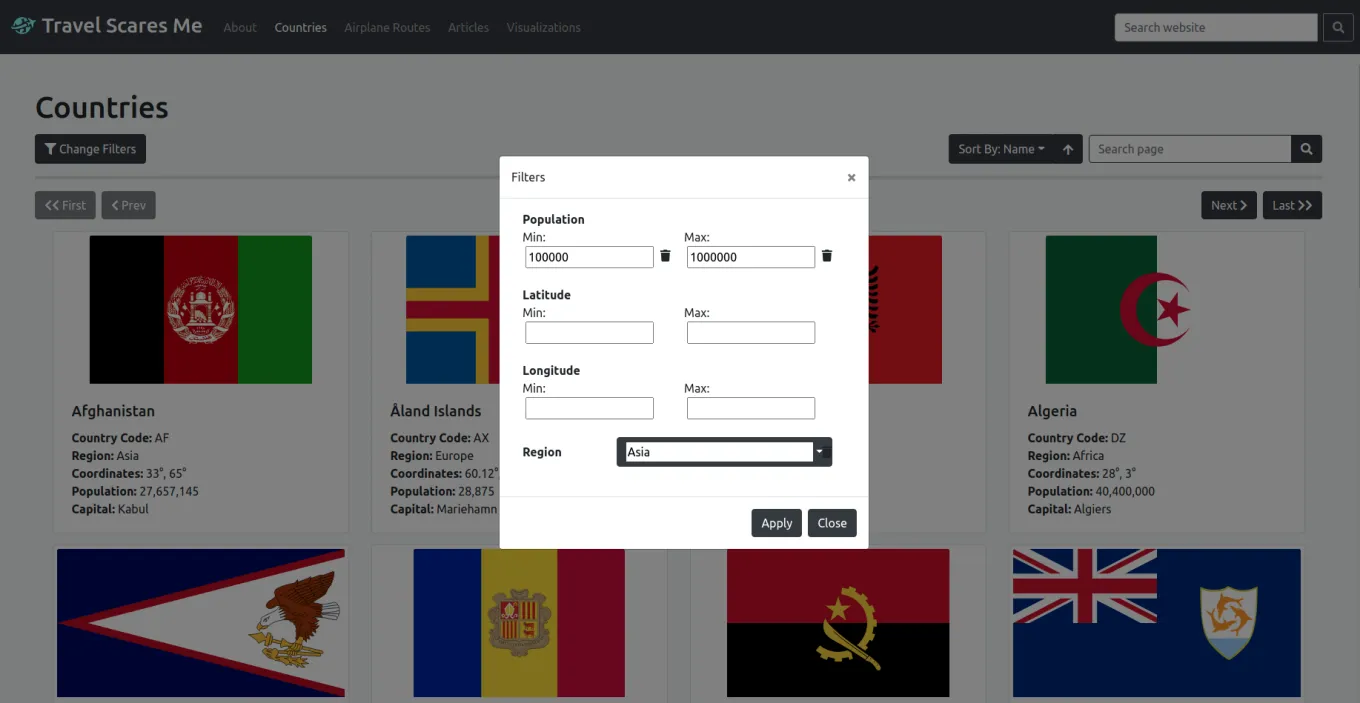
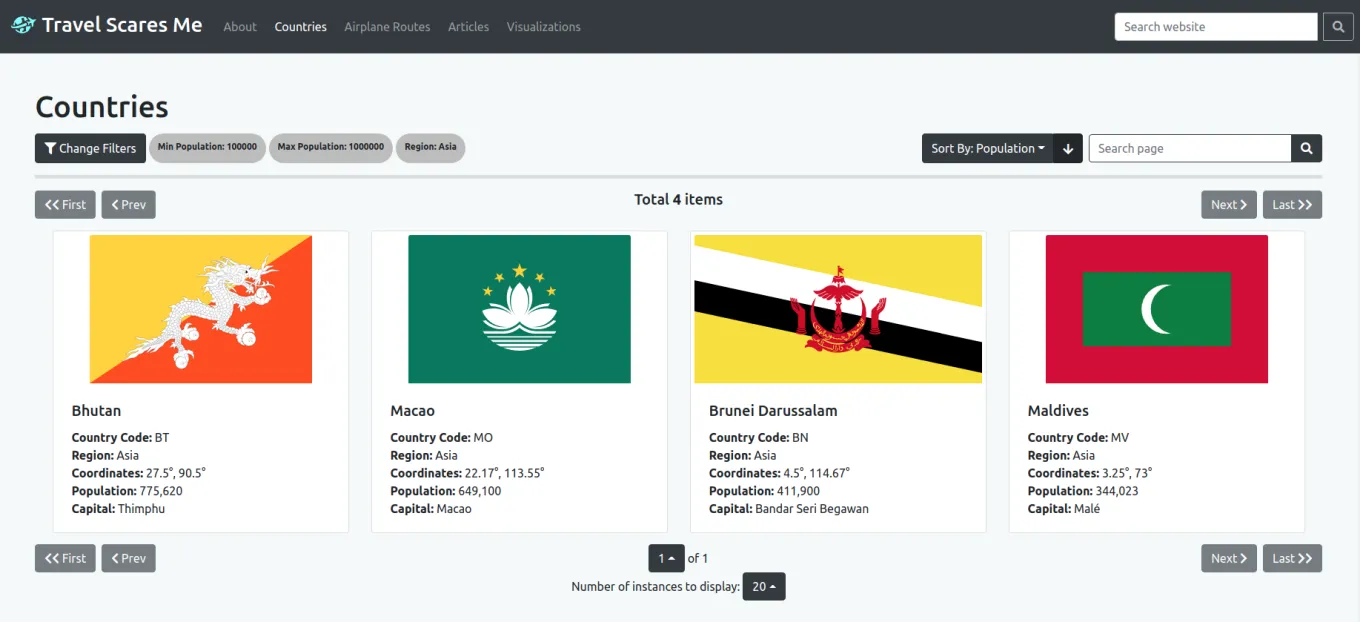
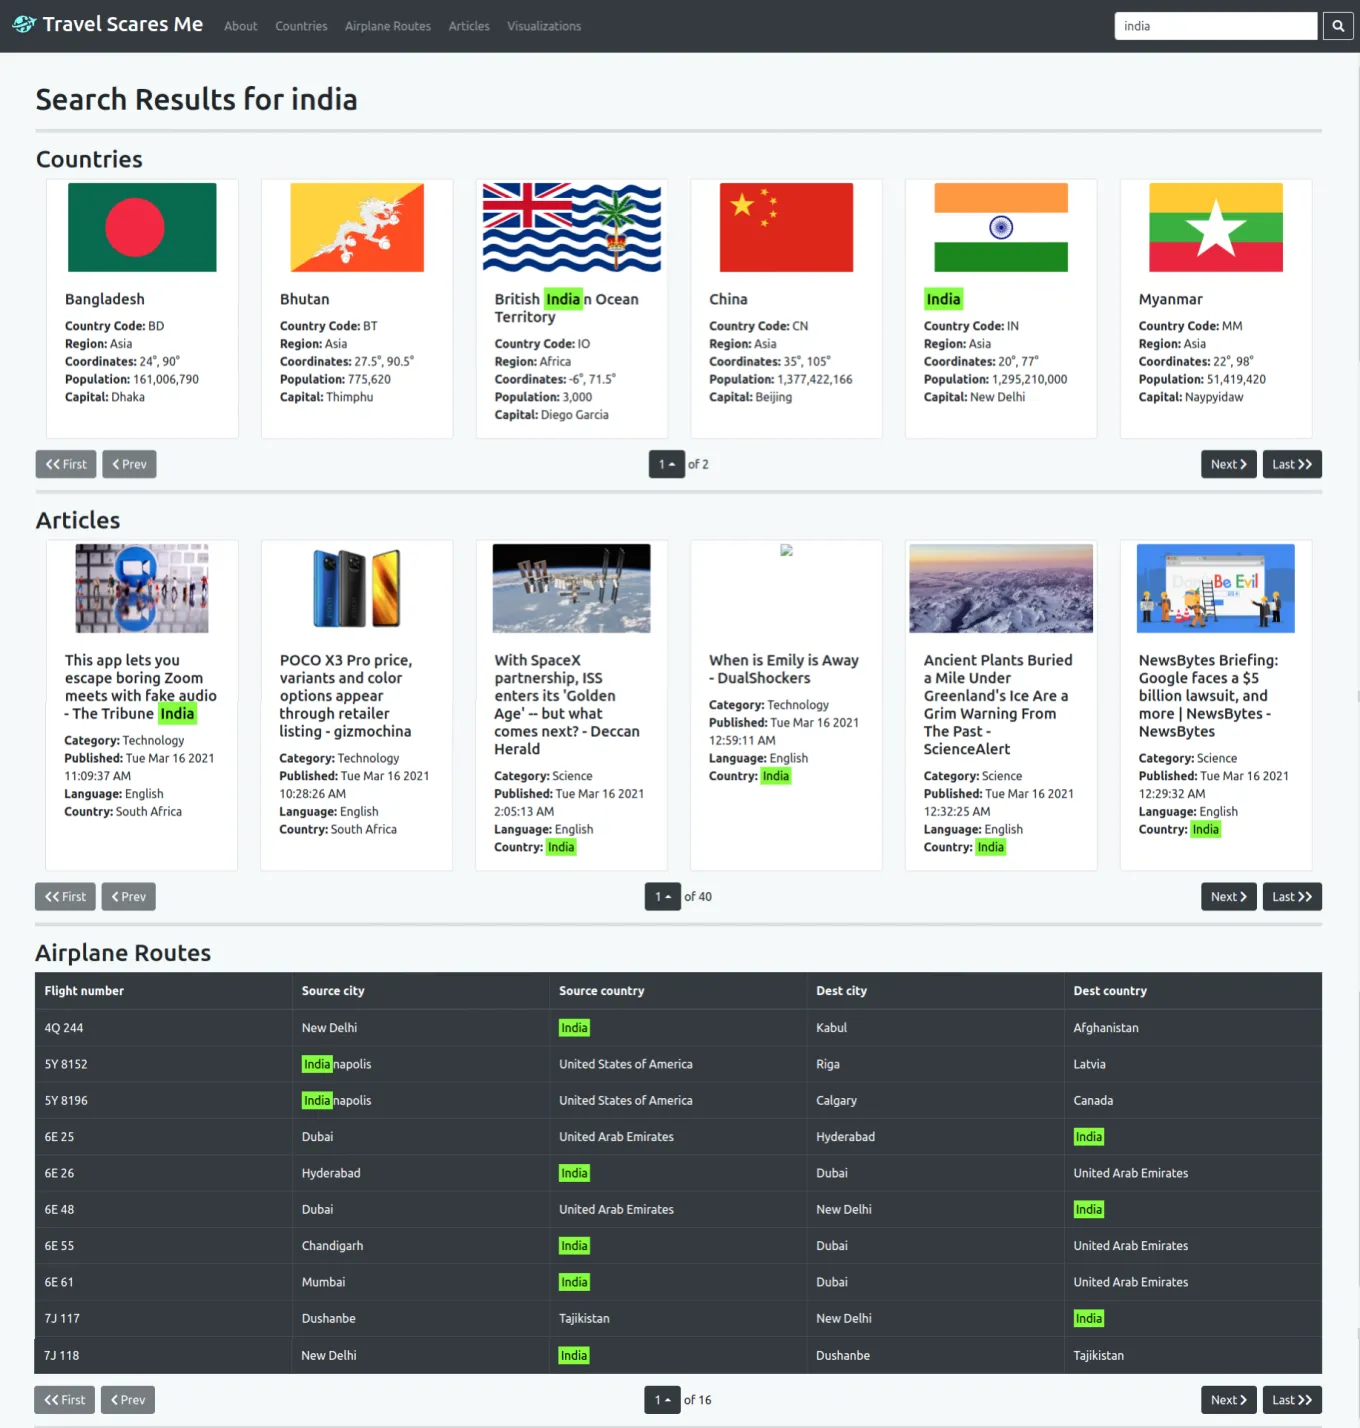
For the frontend, we had to implement the filtering and sorting options into each data model according to the query params available for each data model. We created a modal to change filtering parameters and added a dropdown to change the sorting parameter. Additionally, a search bar was added to each data model page and a global search bar was also added to the navigation. I implemented the global search page which used the search option from each of the data model APIs to combine the data and display it. Lastly, the keywords from the search were highlighted in each data record.
This is an example of filtering and sorting results in a data model page
This is an example of using the global search functionality with highlighting
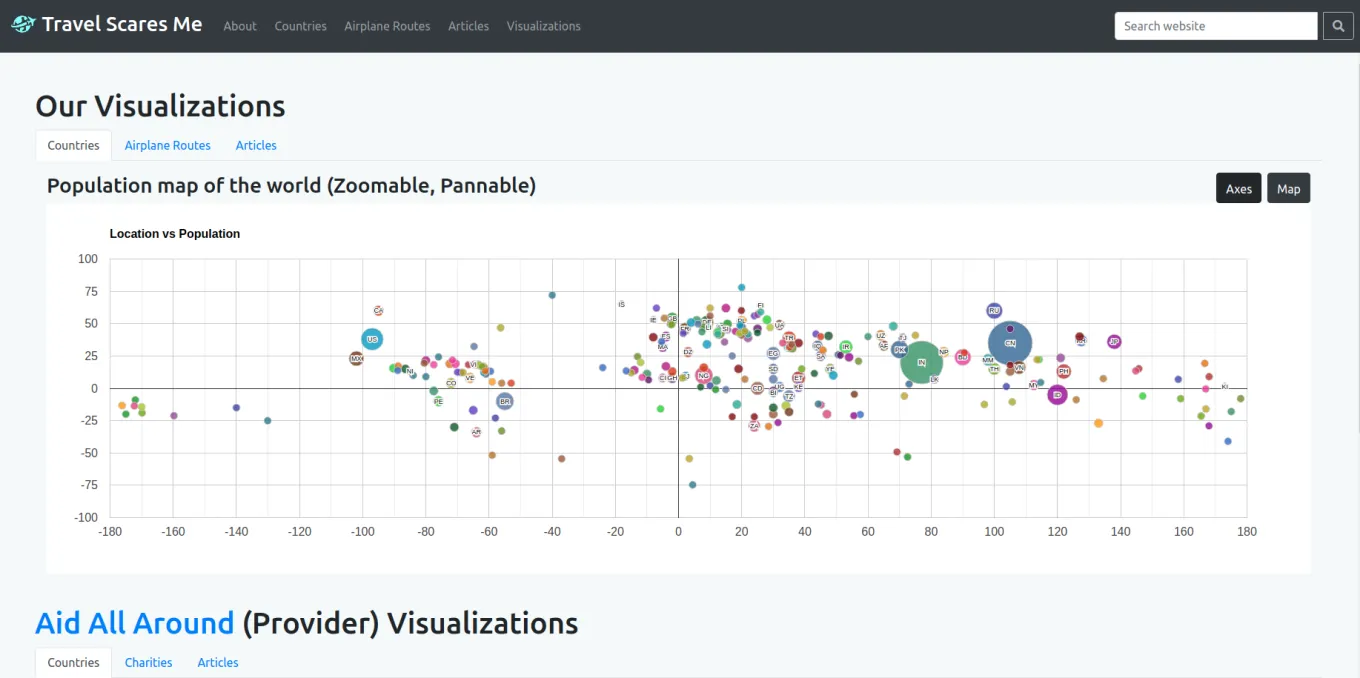
Phase 5: Creating data visualizations and final presentation
In the last phase, we had to create data visualizations using our own exposed API and the exposed API of another team’s website. The visualizations could be generated using any frontend charts library. Popular libraries included D3js, Highcharts, and React Google Charts. We used the last option because of its comprehensible documentation.
We were also responsible for documenting the functionality of the website through a presentation. A demo of our completed website can always be viewed on YouTube.
This is an example of a visualization using our API. I unfortunately don’t
have a visualization of using the API of another team as they took down their
server.
Additional Continuous Learning
Throughout the entire project, we were writing test cases using Jest for the frontend, Selenium for the UI, Python unittest for the backend, and Postman for the API. This is similar to the industry where every component of a product needs to be thoroughly tested. These were integrated using GitLab’s CI tools and Docker images, implying every commit to the repository automatically invoked the running of the test cases in GitLab’s pipelines.
Additionally, each team was a “client” to another team and as a client, our responsibilities included creating user stories for the other team to improve their website interface, evaluating their response to our user stories, and using their exposed API to generate visualizations on our website during Phase 5. Similarly, we were responsible for working on user stories addressed to us by a different team, and also responsible for exposing a good API for them to use during Phase 5.
Lastly, we had to keep updating an ongoing technical report that documented every aspect of our project, from the data models to the AWS architecture to the actual backend and UI implementation. You can read the entirety of the technical report here.